
Chicken Wing Lab
For our most recent lab, my Sports Medicine class dissected chicken wings. The purpose of this was to be able to observe how different parts of the chicken wing, like ligaments, muscles and tendons, work together to enable movement. Each group was given a chicken wing and a set of instructions as to how to prepare the wing. The rest of the instructions were to:
- Review diagram. Rinse and dry chicken wing
- Cut the skin down the middle of the wing until you reach the shoulder
- Cut down the sides of the skin to make a t-shape cut. Peel skin back carefully
- Look for the yellowish tissue, which is the fat
- Observe muscles. Pull the flexor and extensor muscles. Observe how this affects the wing
- Find tendons, the shiny white parts, and pull to see how each tendon moves
- Bend and straighten the joint. Examine the ligaments and bones surrounding the joint
- Notice that in between bones is cartilage, which is shiny, white and slippery
- Move the wing and observe how all of the parts work together
- Write observations in the table
- Clean up
I was the willing dissector of our group.
by Hayley Grassler
As we completed the lab, we took down observations of the characteristics of each component of the chicken wing.
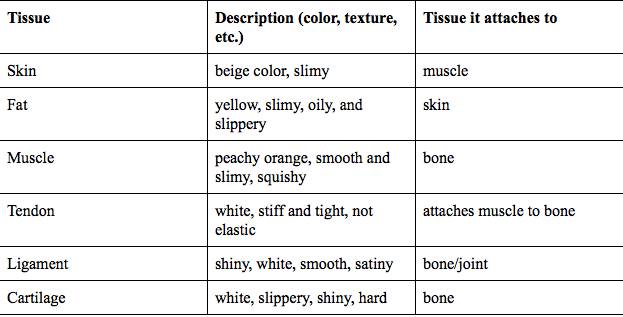
My group’s information about the wing
I was most surprised by the feeling of the tendons. I had always imagined them to be very stretchy, but they were actually rather stiff and unyielding.
After we completed the lab, the data we used enabled me to answer the following conclusion questions:
What type of tissue actually moves the chicken wing?
Why are tendons important to a muscle’s ability to make the body move?
What tissue of the chicken wing is commonly referred to as the “meat”?
Based on your observations, explain the roles of muscles, tendons, bones, and joints in the back-and-forth movement of the lower chicken wing.
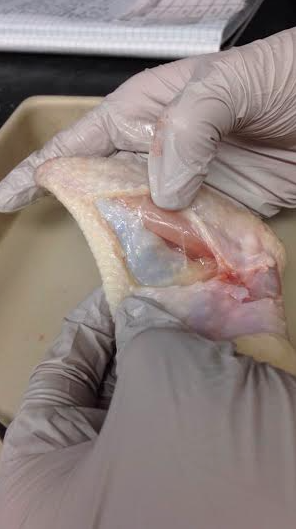
Image by Melissa, expert cutting by me
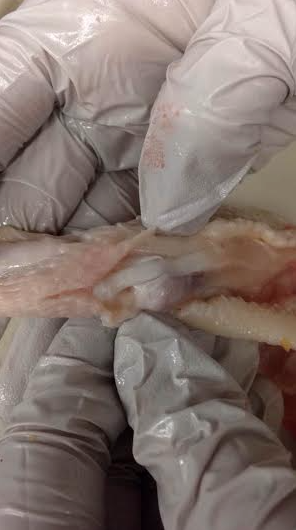
A tendon; image by Melissa
I determined that muscles and tendons move the wing. Clearly every component of the wing is vital to it’s function, but muscles are responsible for the chicken wing’s main movement because as they extend and contract they move the wing up and down. Tendons connect the muscles to the bones, and aid in the up and down motion of the wing. Muscles and tendons must be mentioned together because (in my opinion) they are of equal importance. Without tendons, the muscles and bones would be unable to work together, making any attempt at movement futile.

Image by Melissa
The muscles of the wing are what is otherwise known as the “meat”.
Joints are important to wing function because they connect bones together and allow the movement to be flexible within the wing. Ligaments are important because they bind bone to bone, and hold bones and cartilage together inside the wing. Cartilage is needed because it smooths the movement between the joints and cushions the impact of activity. Muscle is what moves the wing by extending and contracting, and tendons bind the muscles and bones together.
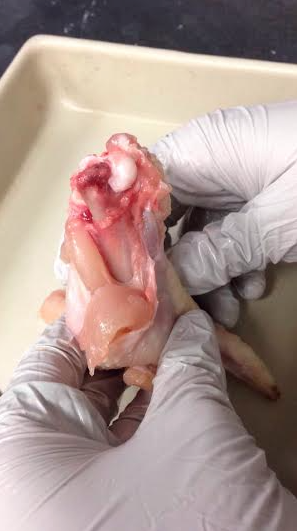
Image by Melissa, my group member
I was not looking forward to his lab, so I was surprised by how much I enjoyed it. I learned a lot about tendons, which was especially interesting to me. I also liked observing how slippery the cartilage was. I got a lot out of this lab and I’m looking forward to doing more in the future!
Sensory Lab ~ February 16th
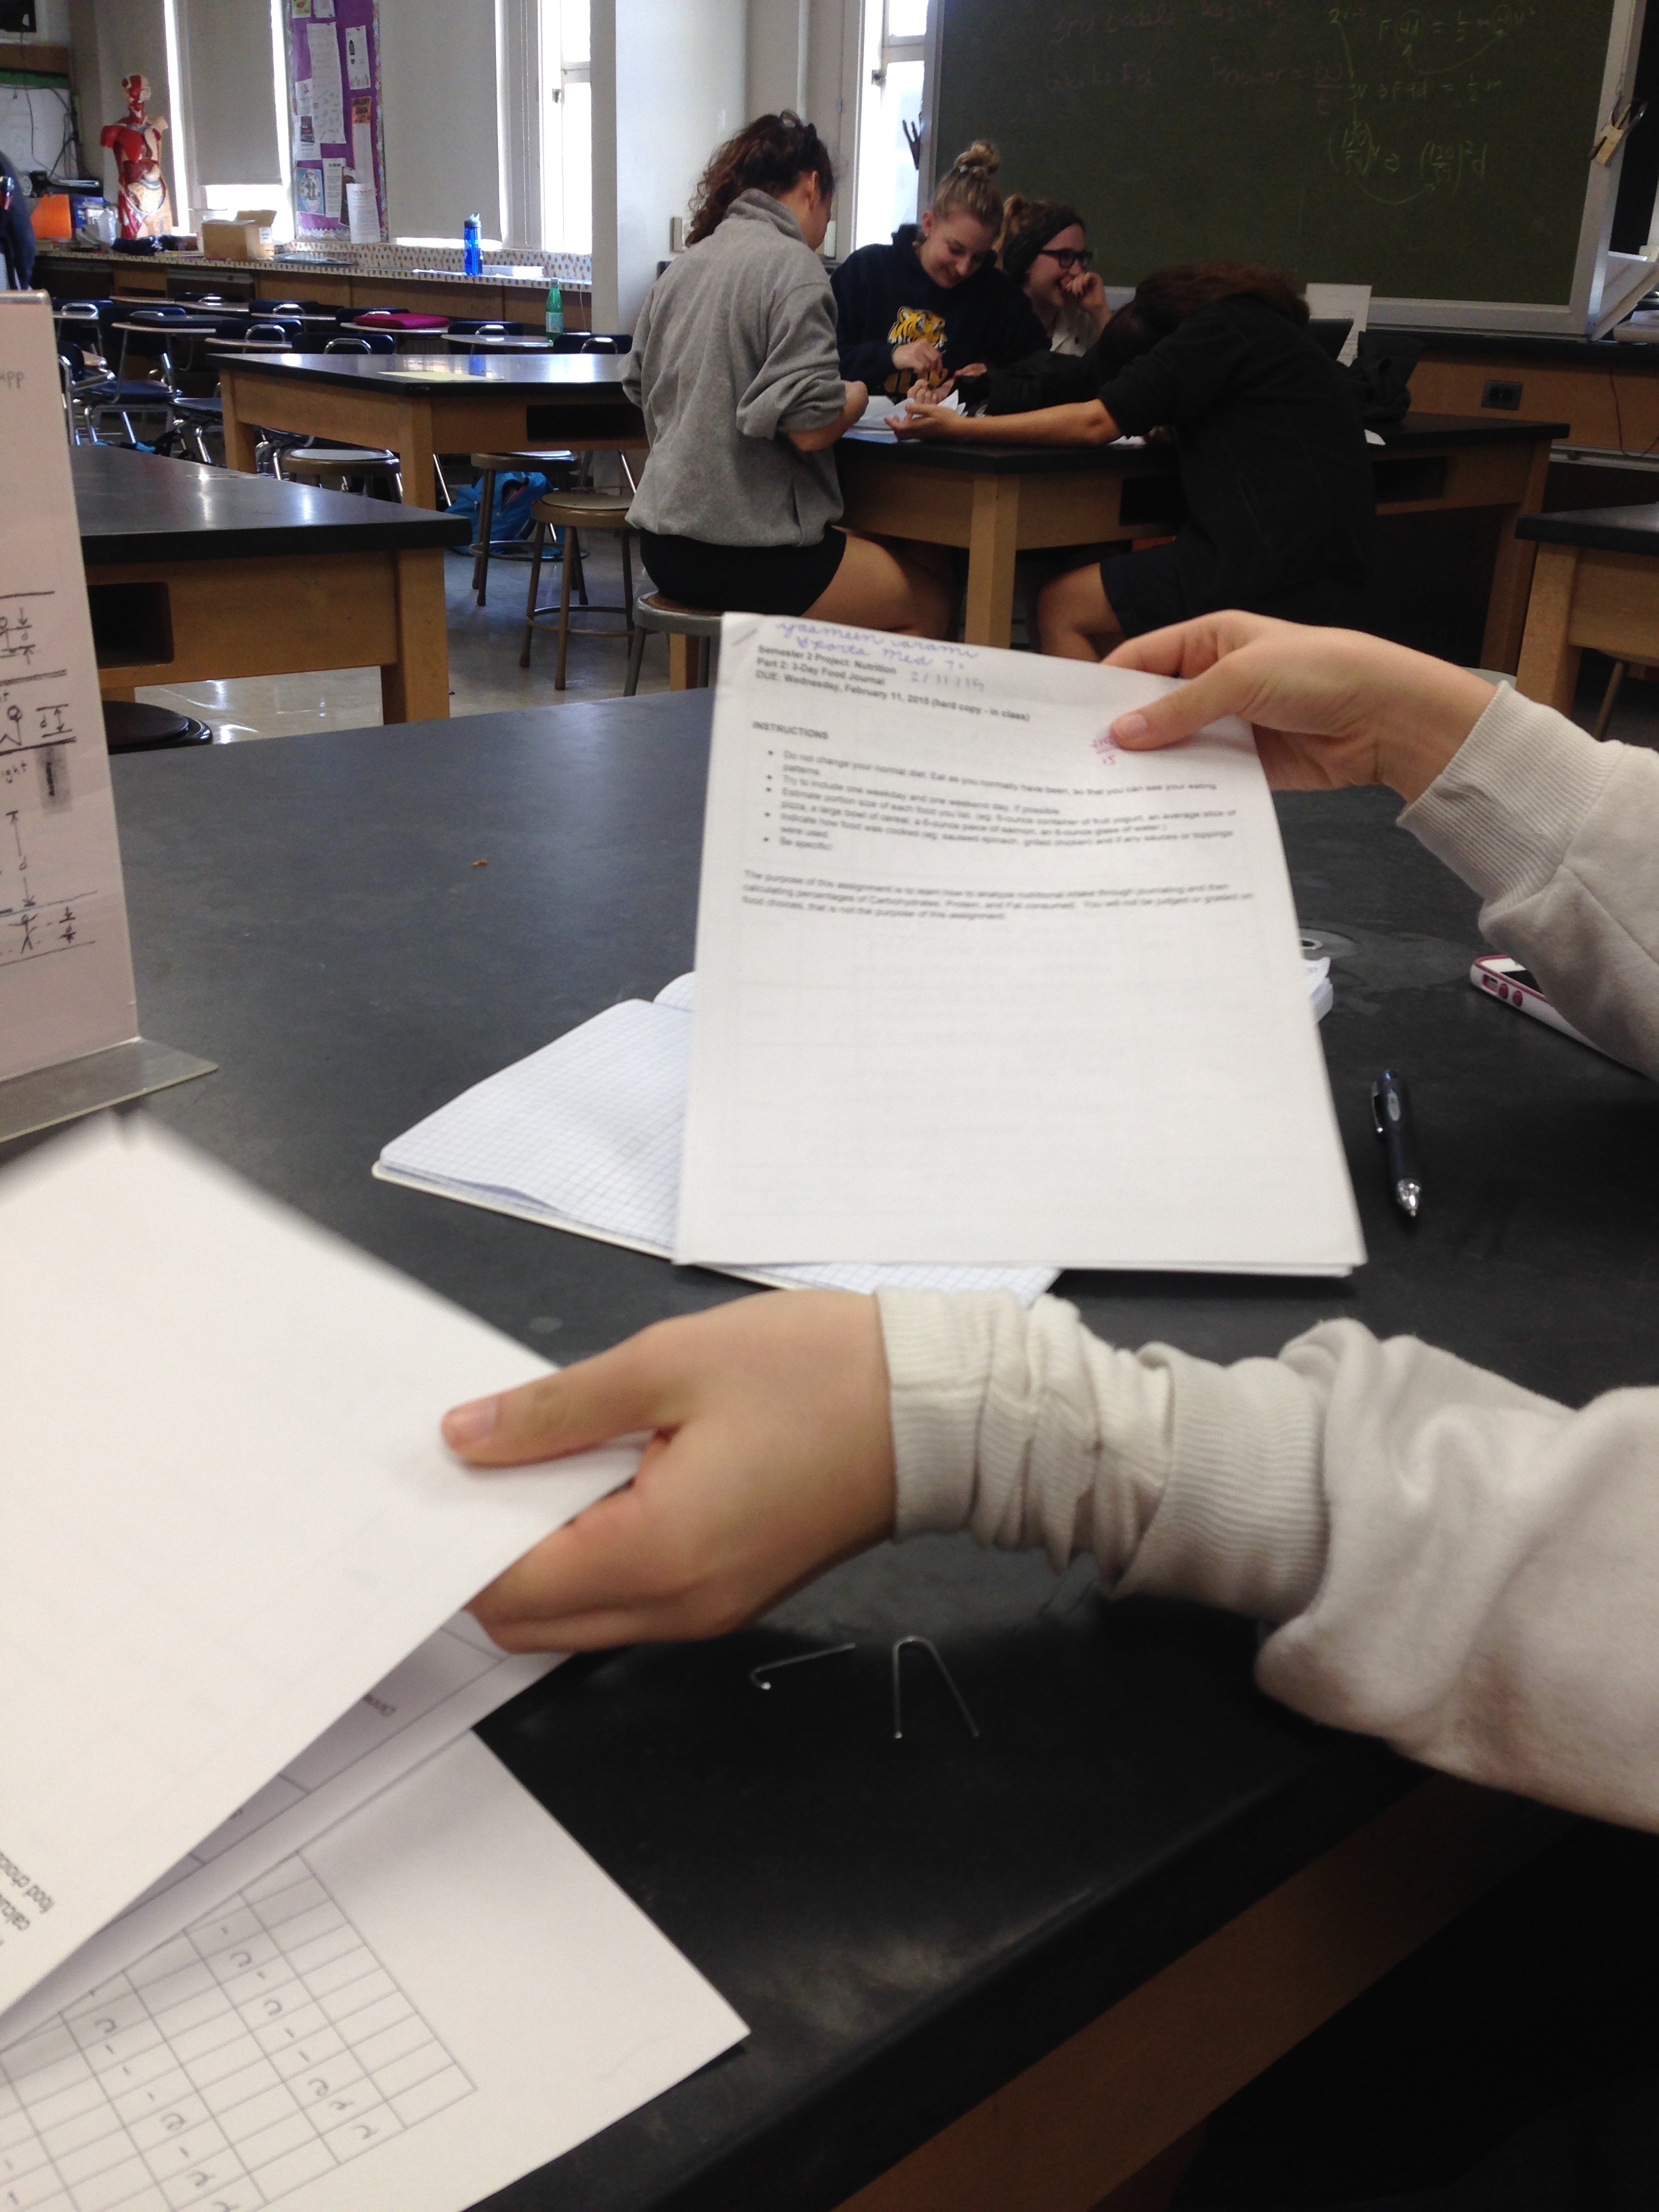
Last week in Sports Medicine, my partner did a mildly uncomfortable lab, the purpose of which was to test the body’s ability to detect light pressure on different parts of the body. I say it was uncomfortable because the basic procedure of the lab was the poke sensitive areas of your body with a paper clip. These areas include the inner forearm and fingertips. This was done in order to determine which area of skin had the highest density of sensory receptors. The areas with a higher density of receptors would be able to feel the difference between a poke with a one or two pronged paper clip. The difference between the two is actually stunningly hard to differentiate between, but the entire process was as follows:
Collecting data from the paperclip poking; by Hayley Grassler
– With a ruler, squeeze the two-pronged paper clip so that the opening is 2cm long.
– While my partner’s eyes were closed, I touched the 1 and 2 pronged paper clip to her skin (on her back of her hand) in a a random pattern 10 times and recorded which paper clip she thought she felt after each poke.
– Taking the rule again, squeeze the paper clip to a 1.5cm opening. Repeat step 2.
– Squeeze the paper clip to 1cm, and repeat step 2
-Squeeze the paper clip to .5cm and repeat step 2
-Move to the forearm and repeat steps 1-5.
– Move to the fingertip and repeat steps 1-5
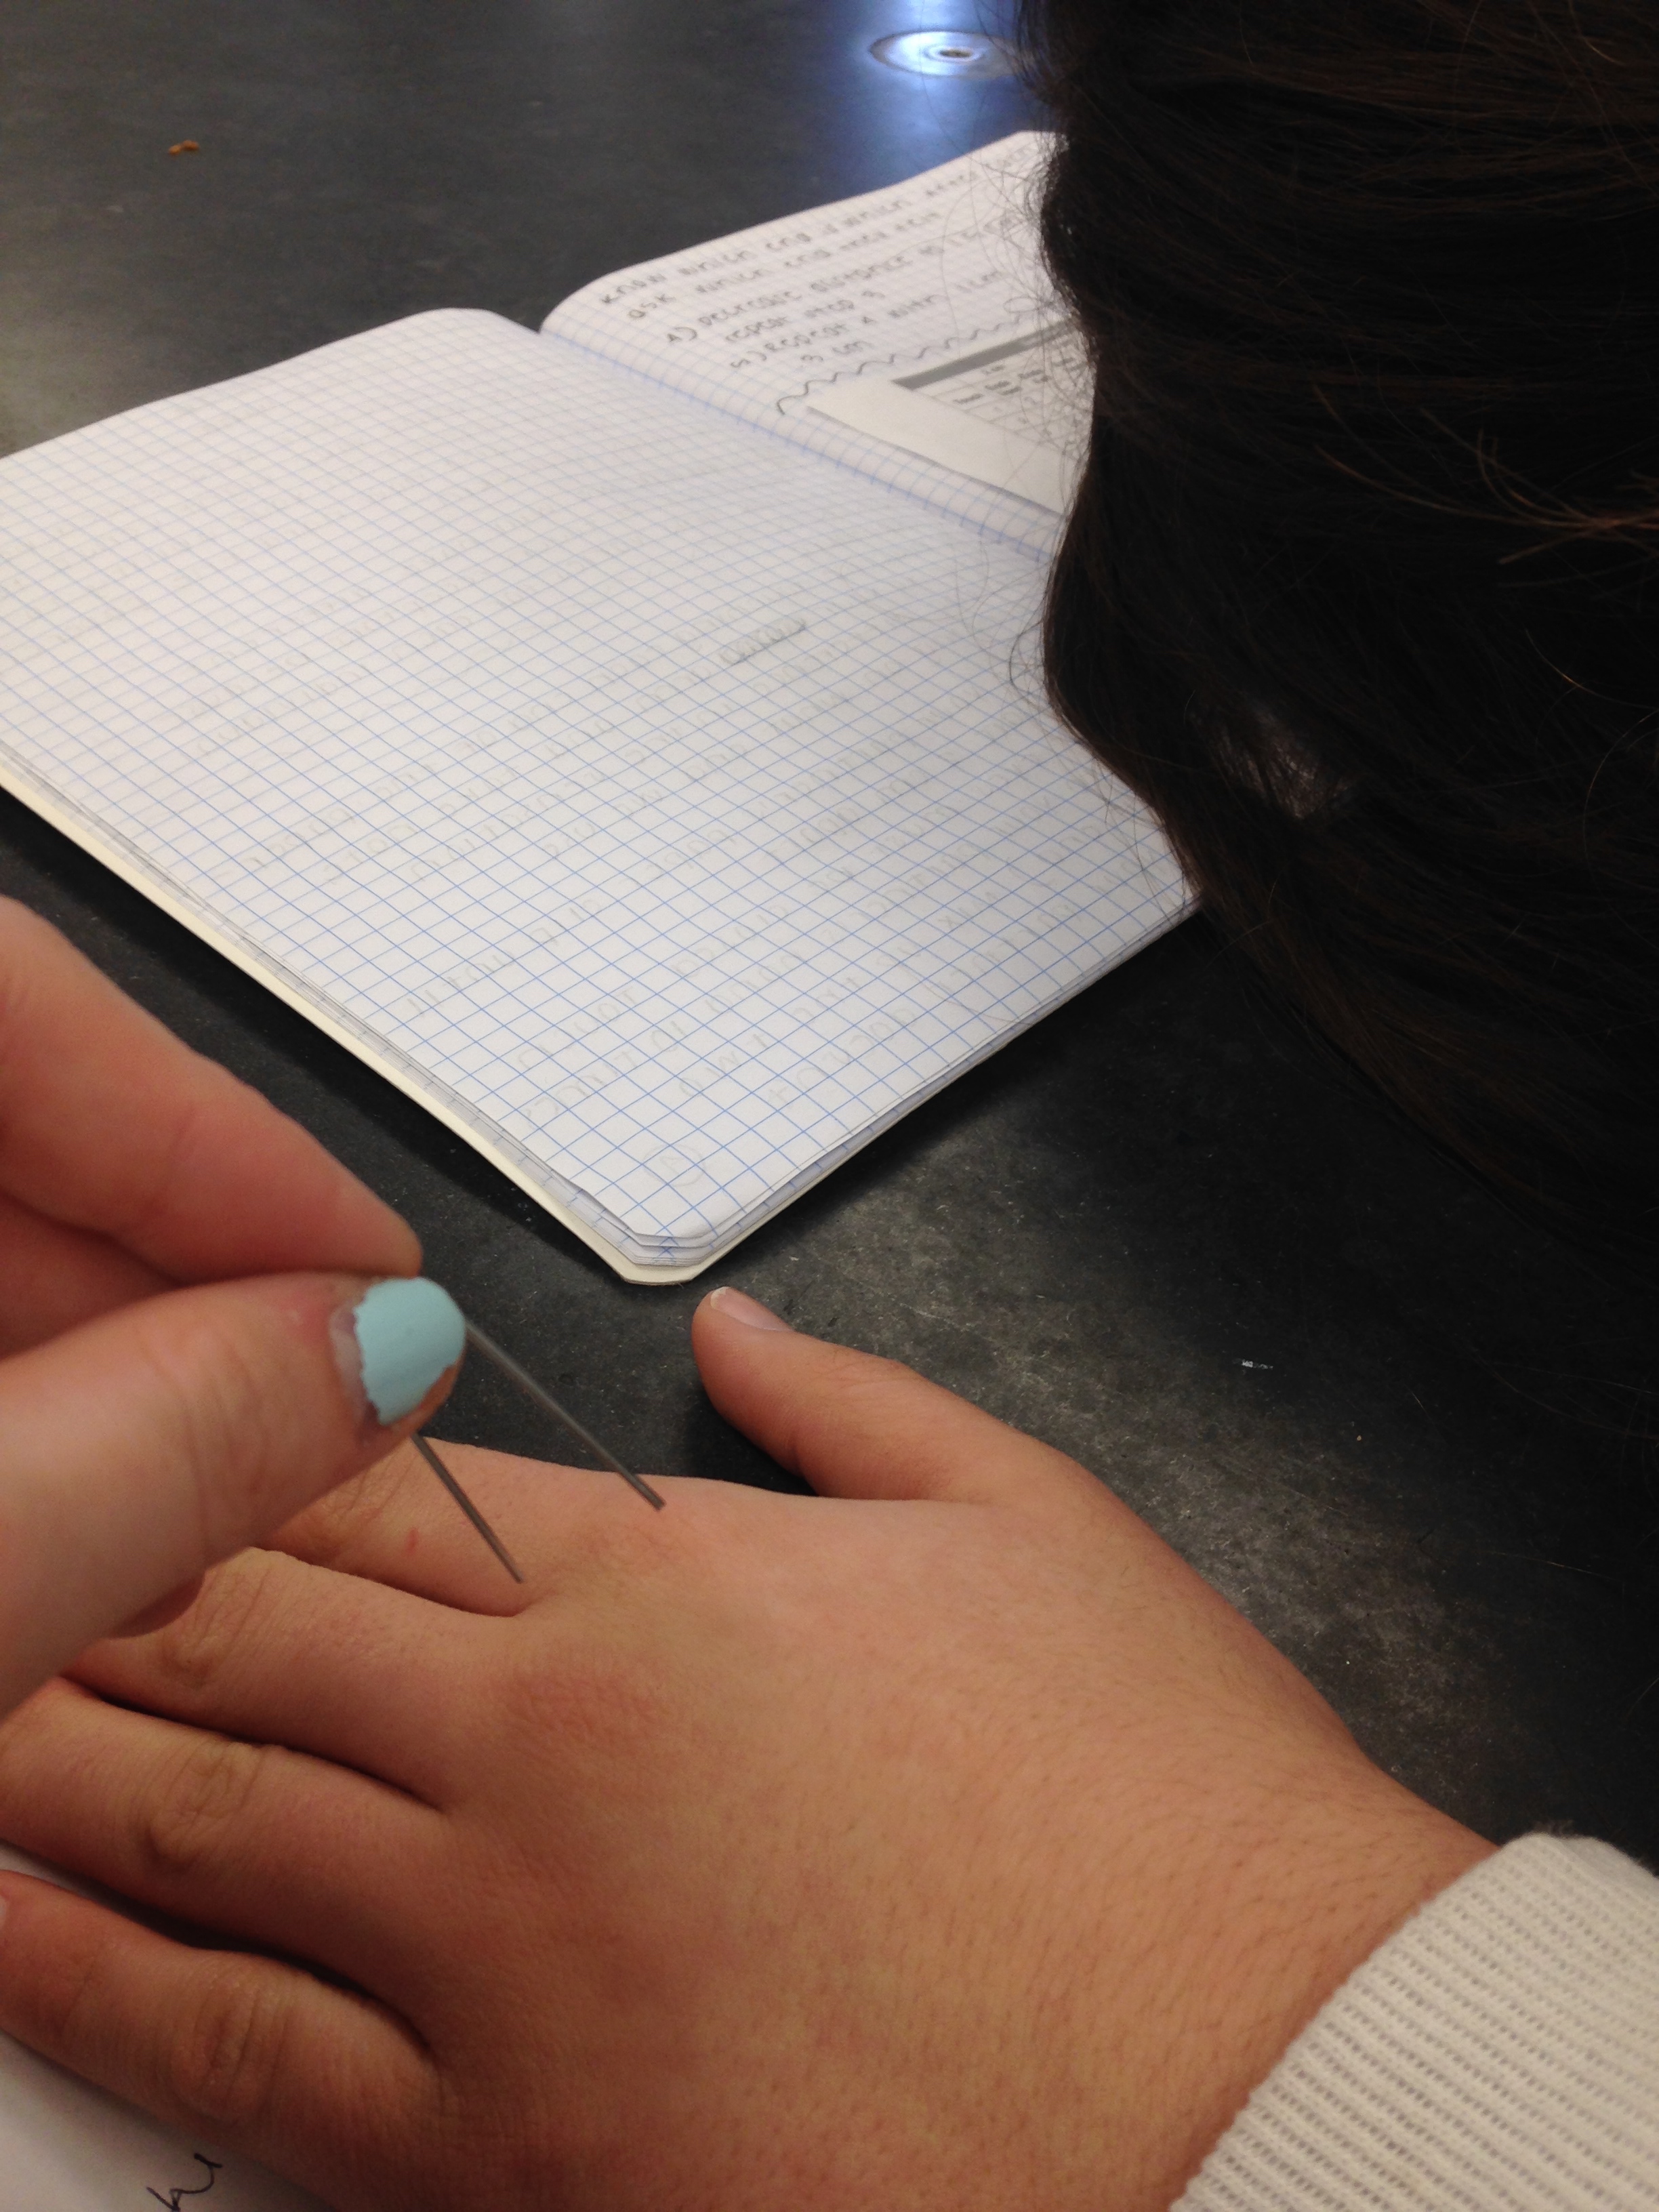
Poking my partner with a two-pronged paperclip; By Hayley Grassler
Image by Hayley Grassler
The entire process was comical. My partner and I initially thought that we would be able to perfectly discern which paper clip was which, but on the forearm trial we both had around 30% accuracy. However, our confidence in our basic motor function was revived when we tried the trial on our fingertips, as we then both had around 95-99% accuracy. These results mean that there is a higher density of sensory receptors in the fingertips.
Post-lab Questions
1. I predicted that the fingertips would have the highest density of receptors. In the data that my partner and I collected, this seemed to be accurate. We were unable to guess the majority of the pokes on the back of the hand and the forearm, but the fingertip pokes seemed easy to differentiate.
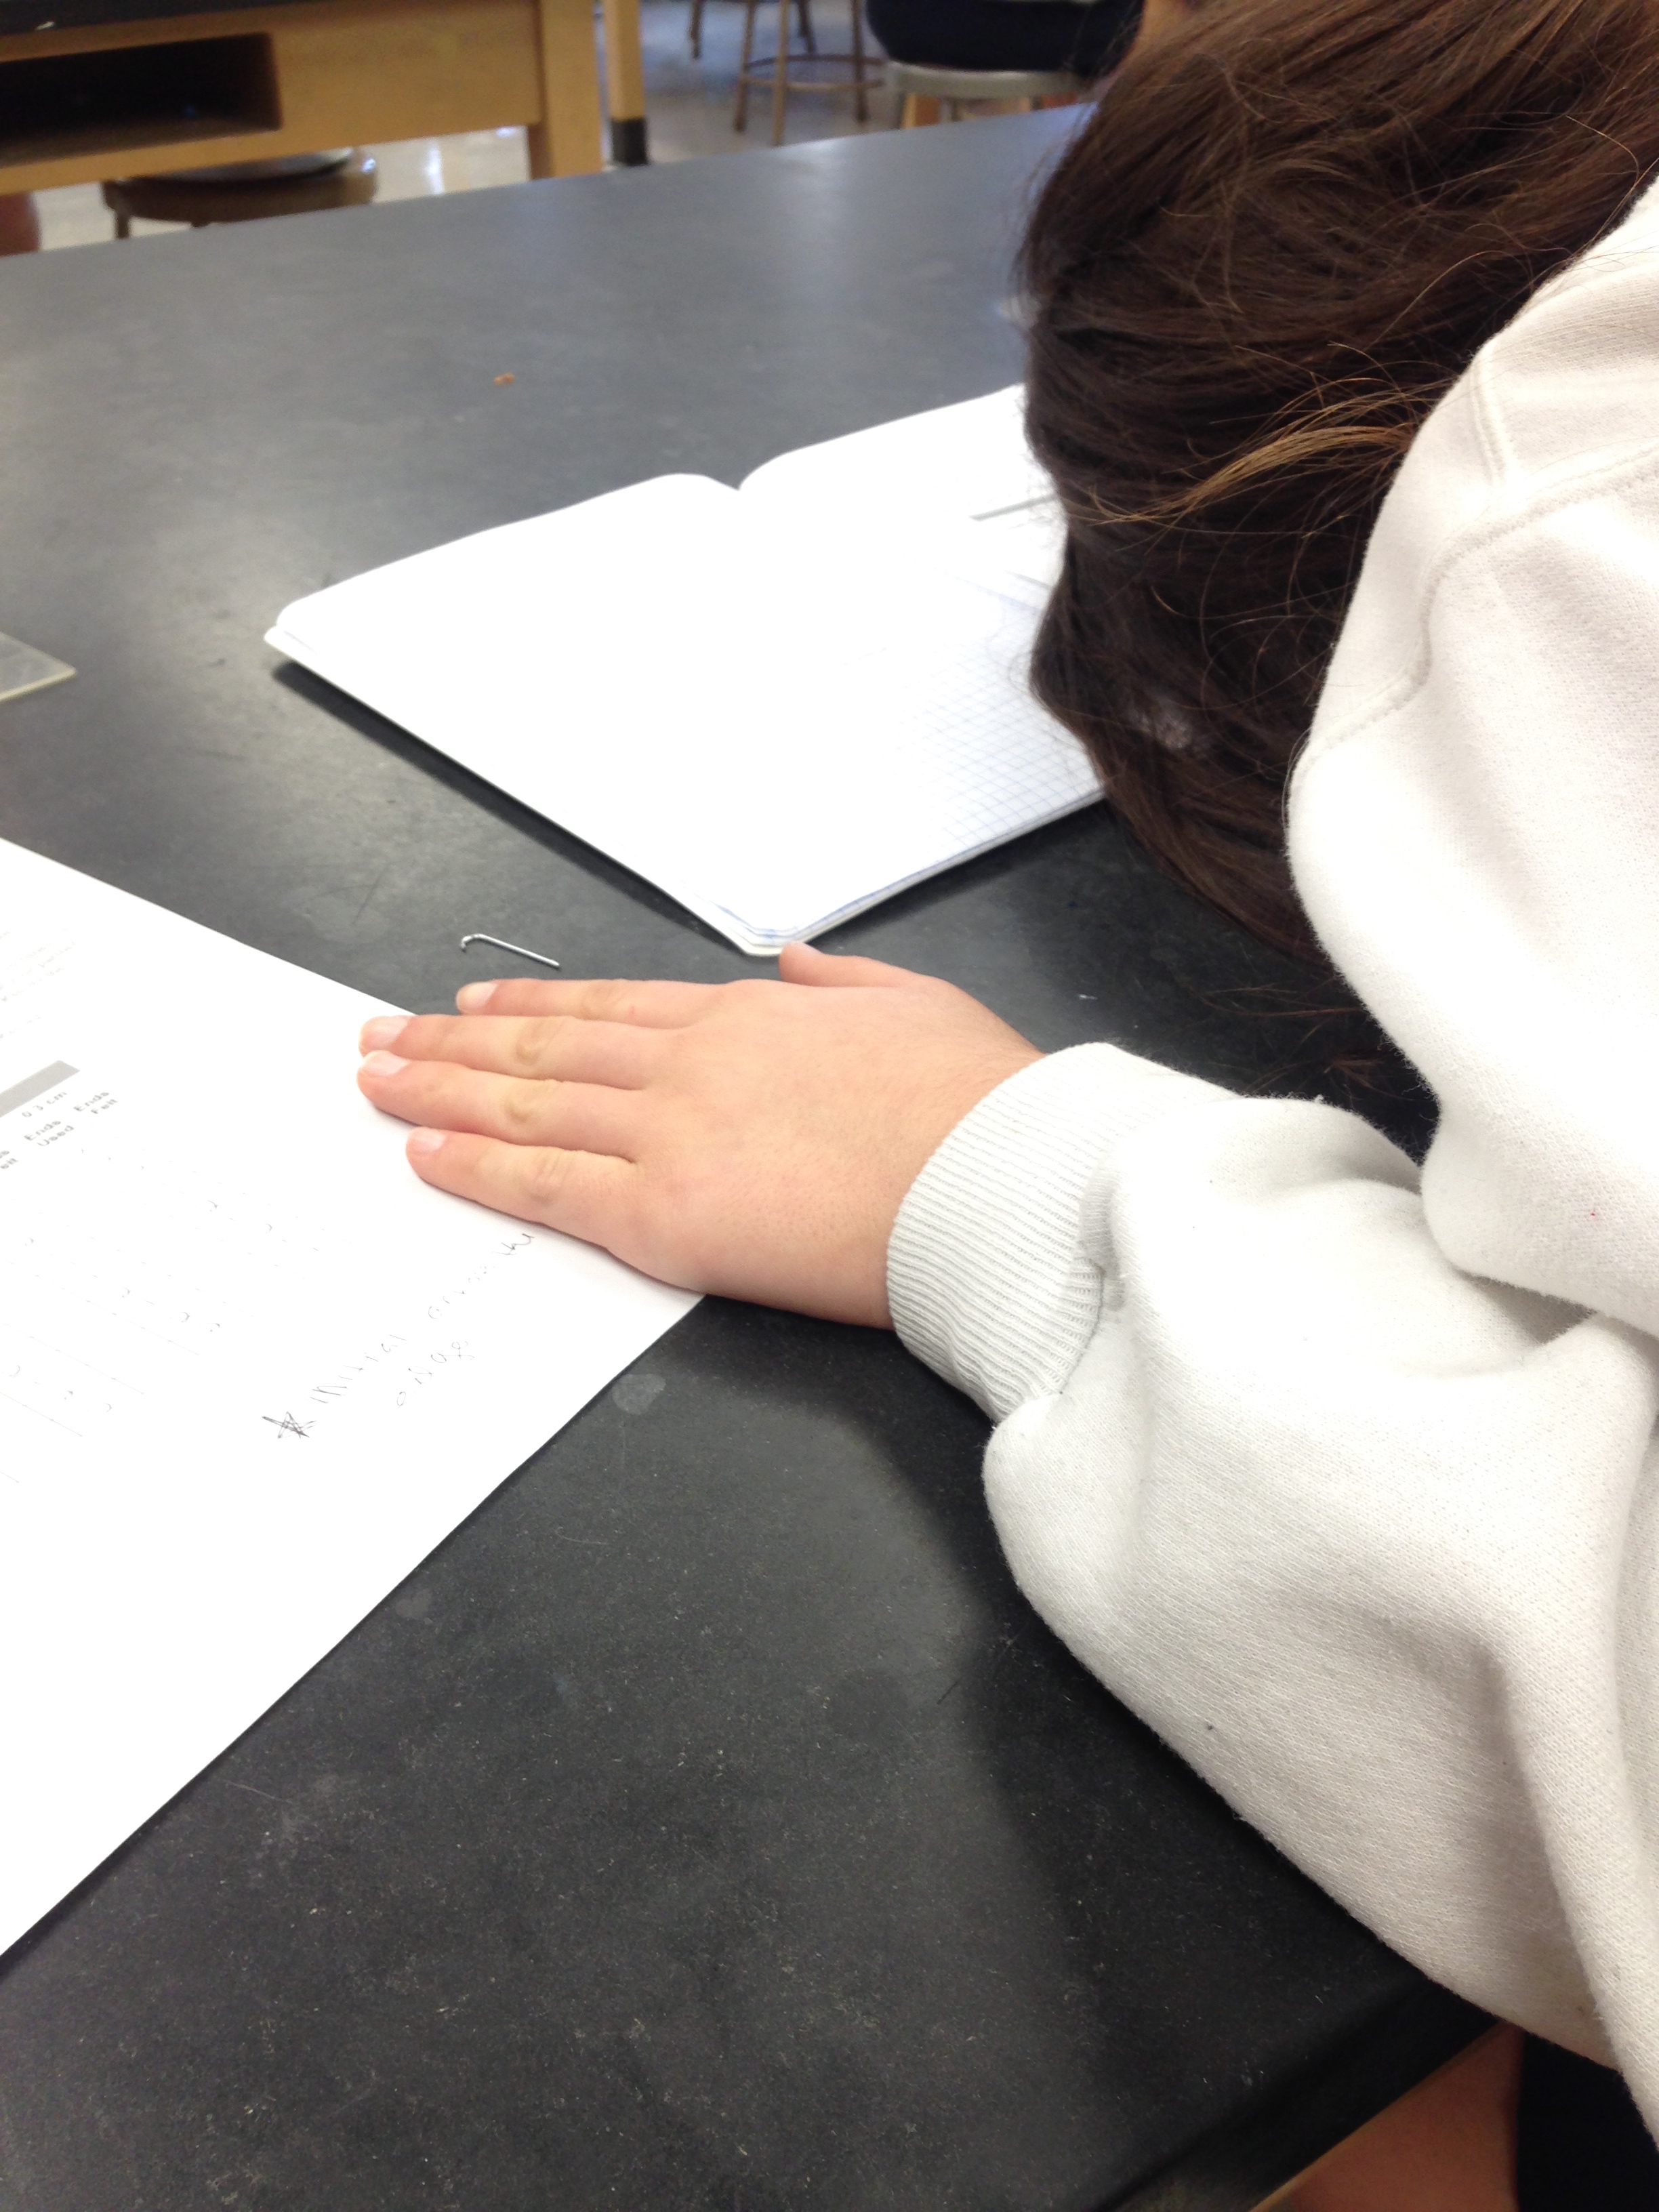
Preparing to poke my partner with a paperclips; by Hayley Grassler
2. Humans have a higher density of sensory receptors in some areas than others because the areas with a higher density are more important to protect. For example, A cut on the forearm might be annoying, but it would not significantly impact your ability to do things unless it was very deep. However, a cut on the finger would affect your ability to pick up things and use your hands which would have a much greater effect on what you were or were not able to do. I think this is a survival mechanism that evolved over the years to protect ourselves.
3. The results that I gathered from my partner and I support the idea that people generally are sensitive in the same areas. Everyone is different, so no-one will be exactly the same in all areas, but sensitivity can also differ based on how much pressure is applied to one area.
4. Participating in activities that involves lots of friction or repeated motion like playing the guitar or using a saw could produce calluses, which would make it more difficult for that person to feel pressure on their sensory receptors in that area.
5. Repetitive activities like those mentioned above could dull the sensitivity of sensory receptors because over time or repeated actions, fingers or hands will get used to the pressure that is applied to them, or develop toughened skin over the areas. This would decrease sensitivity, which could be both detrimental or beneficial.
The dark on the fingertips represents calluses.
By Hayley Grassler
This is my favorite lab that we have done. It was interactive, and I feel that it showed the difference in what I would or would not feel very well. It has also made me wonder how many things I don’t feel throughout the day. I never bruise, but this also explains why my sister bruises so easily and yet sometimes does not feel it, because some areas are more sensitive than others.
A Case Study on Carbohydrates ~ February 2nd
Recently, it has become increasingly more common for people to believe that all carbs are bad for you. At times it seems as though they are almost feared. However, in Sports Medicine, our group was assigned to read through a case study that might prove that carbs are not actually something to be afraid of. The case study involves two girls who each read an article that talks about farmers trying to get their animals vaccinated in order to reduce methane emissions (which we then discover is just a polite way of saying that they are trying to make their animals fart less). The two girls, Sarah and Emily, are interested in how this could be applied to real life. Our group’s job was to determine which foods consumed throughout their day had carbs, which carbs would be the most difficult to digest, and come up with a rule to classify carbs.
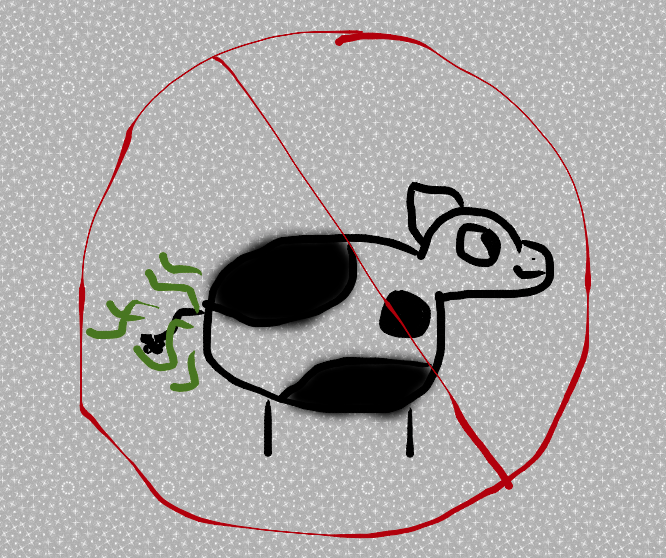 Stunning artwork courtesy of Hayley Grassler
We came up with the rule the first: wheats, breads and pastas all have carbs. We then learned that most sugars are also carbs, so we added those to the list as well.
Then, we analyzed all the foods that had been eaten and discovered that all the following foods had carbs with the exception of the tuna: cheerios, oat bran, a tall latte with skim milk, a Powerbar, Coke and a salad with lettuce, cabbage, tomato, shredded carrot, green peas, kidney beans and tuna fish. The meat was the only food without carbs.
Polysaccharides are a leading cause of gas, so we also looked at the foods that had been eaten and tried to figure out which ones would produce the most gas. Simple sugars, insoluble fiber and starches were the hardest to digest, and thus produce the most gas. My group then examined the label of a Powerbar and found that it is 15% carbohydrates. Furthermore, 31.1% of the carbs within the Powerbar were simple sugars, which are very difficult to digest and would thus produce gases.
 Hayley Grassler
As I briefly mentioned earlier in the post, carbs aren’t always bad because it is actually extremely dangerous if not impossible to omit all carbs from your diet. You won’t get the energy needed for survival without them.
However, some carbs are certainly better than others. We learned that simple sugars are monosaccharides, starches are disaccharides, and fibers are polysaccharides. We used this information to analyze the rest of the ingredients in the Powerbar. Salt and glycerin are simple sugars, corn syrup, rice crisps, and peanuts are starches, and maltodextrin and oat bran are complex carbohydrates.
 Hayley Grassler
EKG Lab ~ October 27th, 2014
1. Introduce the lab, what was the purpose?
The purpose of this lab was to be able to see a visual representation of the electrical pulses in a heart over a given time. This was done to better our understanding of the waves seen in an EKG test, calculate the heart rate based on the waves, and compare and contrast the waves of a normal heart beat and a simulated heart attack.
2. How did you carry out the lab, what steps did you take, what data did you collect?
The materials used for this lab were:
- Electrode tabs
- Vernier EKG sensor
- LabQuest app
- LabQuest
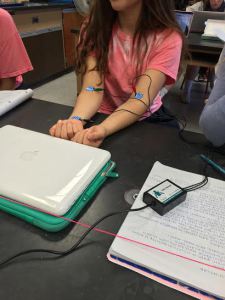 Photo by group member Diana Pietila
For this experiment, Yasmeen was chosen to be the subject. First, the EKG sensors were connected to the LabQuest, which was connected to a laptop. Then, after selected File, then New, Yasmeen’s arm was cleaned with alcohol and three electrode stickers were attached. One patch was attached to her upper right forearm, and the other was attached on her left upper forearm. Then, the EKG clips were attached to the electrode sticker bases.
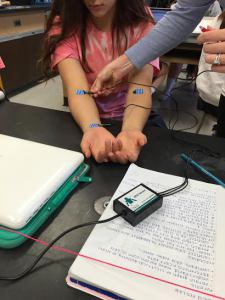 Photo by group member Diana Pietila
Yasmeen was put in a relaxed, seated position, and the test was started on the laptop. Her heart rate was displayed, and the other members of the group collected this data and transferred it into a data table, pictured below.
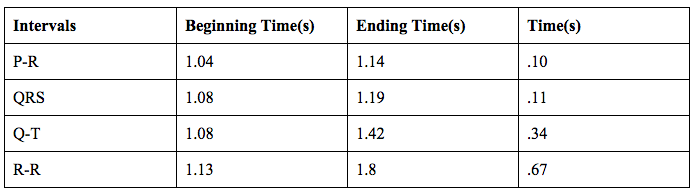
The data on this table is the data that was collected during the lab after each trial was completed. After it was done, we determined the length of each interval by scrolling over the point at the beginning of the heartbeat and scrolling over the ending of the heartbeat. Then, we calculated the difference between the two times and divided it by 60, the number of seconds in a minute. To calculate heart rate, we divided 60 by .67.
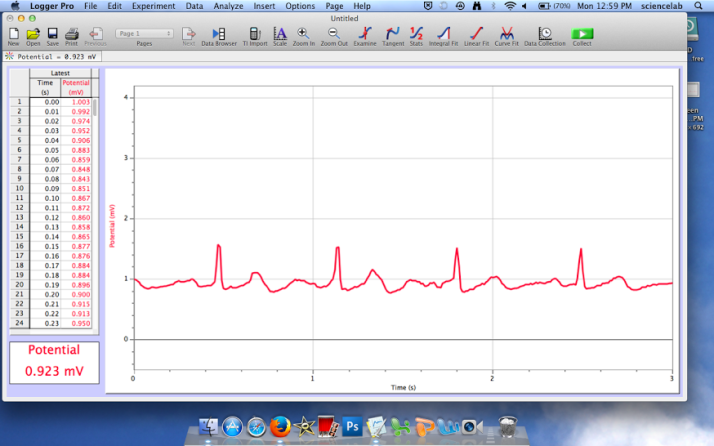
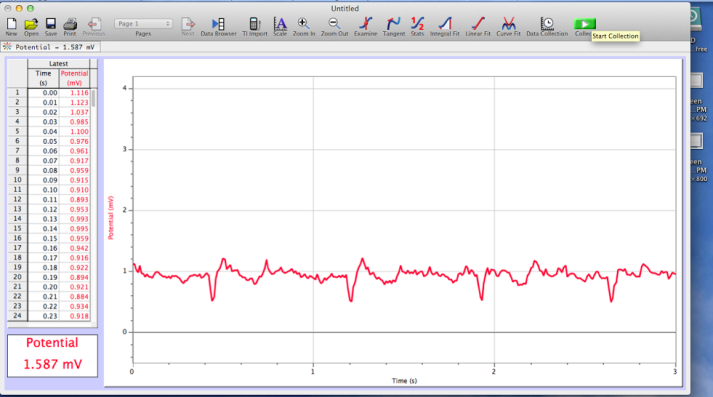 The graphs shown are screenshots of the trials, taken from the science laptops that were used during the lab.
What conclusions did you come to?
After analyzing Yasmeen’s heartbeat on the LabQuest and finding the appropriate points, we determined that her heart rate was 90 beats per minute. We figured this out by ascertaining the time of Yasmeen’s heartbeats and waves, which were .10 for P-R, .11 for QRS, .34 for Q-T and .67 for R-R.
Homeostasis Lab ~ October 8th, 2014
1. Introduce the lab, what was it’s purpose?
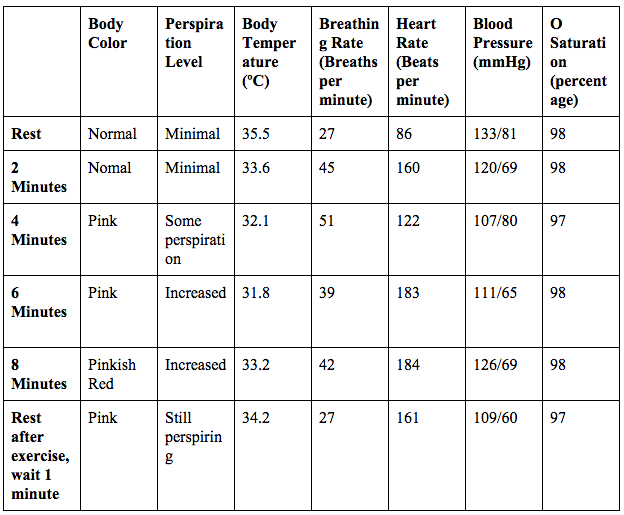
In order to learn about how the human body reacts to physical change, the class completed a lab about how the body maintains homeostasis. During this lab, one member of each group had to do jumping jacks for 8 consecutive minutes, and then take a one-minute rest period. Each trial lasted for two-minute intervals, and at the end of the two minutes, the remaining members of the group quickly measured the change in skin color, perspiration, breathing rate, blood pressure, heartbeats per minute, percentage of blood oxygenation, and body temperature. The purpose of taking these measurements was to see the effect that exercise had on the body.
2. How did you carry out the lab, what steps did you take, what data did you collect?
For this lab, special instruments were required to take some of the measurements used for data. To conducts the tests, the materials used were:
- 1 student doing exercise
- 1 stopwatch
- Paper towels
- 1 thermometer
- Alcohol
- Blood pressure cuff
- Pulse oximeter
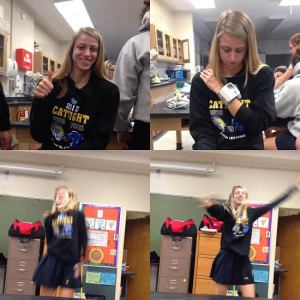
The student who courageously did the jumping jacks, Ciara, (seen doing jumping jacks in this video) was observed before exercise began to measure her resting measures of skin color, perspiration, breathing rate, blood pressure, heartbeats per minute, percentage of blood oxygenation, and body temperature. Next, a timer was started for 2 minutes and Ciara began jumping. After two minutes the pulse oximeter was placed on her finger, the blood pressure cuff was fastened around her arm, a thermometer was stuffed under her armpit, and her skin was observed for signs of perspiration and change in body color. This process was repeated every two minutes for eight minutes, and then Ciara was allowed to rest for one minute, and then after this minute Ciara’s skin color, perspiration, breathing rate, blood pressure, heartbeats per minute, percentage of blood oxygenation, and body temperature were all measured again.
For each trial, the data was put into a table. The table below shows the data that was collected.
3. What conclusions did you come to?
The data was put into different columns. In column one, the effect of exercise on body color was tested. Our lab group hypothesized that Ciara’s body color (on face and hands) would turn pink and then red as the exercises continued. This hypothesis was shown to be supported as the Ciara’s body color increased from pale to pinkish red and back down after the exercise ended and she took the rest period. This occurred because of vasodilation, which occurs when capillaries closer to the surface of a person’s skin will fill with blood so that the heat in the blood can be released easily.
In column two, we tested the effect of exercise on perspiration levels. The hypothesis was that the subject’s perspiration level would increase from none to moderate as the tests progressed. This hypothesis was supported by the data collected. Ciara’s perspiration levels increased as the jumping jacks continued.
In column three, we tested the effect of exercise on body temperature. We hypothesized that the subject’s body temperature would increase. However, the her body temperature decreased. After researching, we discovered that this was a result of the increased perspiration. Perspiration helps the body cool down during exercise because heat is released when the fluids exit the skin.
In column four, the effect of exercise on breathing rate was tested. We hypothesized that the subject’s breathing rate would increase. The hypothesis was clearly supported by the data. After researching, we found that the body needs extra oxygen during physical activity to compensate for oxygen it loses, and that the muscles especially need the increase in oxygen.
In column five, the effect of exercise on heart rate was tested. We hypothesized that Ciara’s heart rate would increase. The hypothesis seems to be supported except for a sudden drop at the four minute interval. Besides the fourth minute, the hypothesis seems to be correct in all other intervals. The reading may be due to experimental error; the pulse oximeter may not have been placed properly, the numbers may have been read wrong, or the subject may have been resting for an extended time before the reading was taken. After researching, we found that the heart rate increased as a result of the increasing physical activity in order to pump oxygenated blood throughout the body.
In column six, we tested the effect of exercise on blood pressure. We hypothesized that blood pressure would increase as the duration of the exercise increased. However, the hypothesis was not supported because the blood pressure declined over the course of the exercise. Although the blood pressure rises slightly at the four and eight minute intervals, which were outliers, an overall decrease in blood pressure was demonstrated as exercise continued. This could have been the result of human error in reading the blood pressure cuff inaccurately or placing it in the wrong spot, waiting different amounts of time in between readings, or inconsistent placing of the monitor. After researching, we found that the decrease could have been a result of the athlete’s physical fitness, because a strong heart exerts less force on the arteries, or because blood vessels in muscles dilate when metabolic by products like lactic acid enter the bloodstream, so blood flow remains high which results in a lower blood pressure.
In column seven, we tested the effect of exercise on oxygen saturation in blood. We hypothesized that the oxygen saturation would decrease as exercise continued, however, our hypothesis was not supported. The percentage of oxygen saturation generally remains the same, except for a slight dip in the 4 minute mark. After researching, we found that the blood’s oxygen saturation would have remained consistent because of the body’s ability to compensate for oxygen loss in other ways throughout the exercise, such as heavier breathing and a faster heart rate.
We learned a lot of interesting things during this lab, especially that blood pressure lowers rather than rises during a period of exercise. It was very interesting to see how quickly the body adapts to maintain homeostasis.
